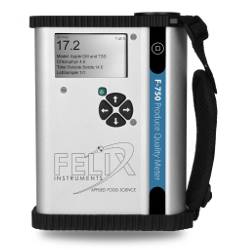
The F-750 Produce Quality Meter is a portable measurement
tool that analyzes both the internal and external traits that
contribute to produce quality. NIR (Near Infrared analysis)
has been used in fixed installations to provide Objective
Quantifiable Quality standards in produce sorting for years.
Our portable battery operated device allows a grower to take
NIR analysis into the field where better and more consistent
maturity determination can add value to a crop before
harvest. aBuilding a Model
The F-750
The F-750 reports quantitative estimates of substances (e.g.
Chlorophyll), traits that involve multiple substances (e.g.
ripeness, TSS, DM) and qualitative metrics (e.g. flavor
index, personal preference index).
Product Features
Non-destructive estimation of fruit maturity and sweetness related
parameters:
- Non-destructive estimation of fruit maturity and sweetness related
parameters:
- Total Soluble Solids (Brix)
- Dry Matter
- Internal Color
- External Color
- Titratable Acid
- GPS for easy crop mapping
- Transflective display for outdoor viewing
- Rechargeable/replaceable batteries
- SD card data storage
Building a Model
- 10 � 200 fruit subjects are measured using the F-750 Produce Quality Meter
- The quality parameter of interest is measured on each of the subjects using an alternative destructive method (ie; Brix is
measured using a refractometer).
- The included model building software combines the data from step 1 and step 2 to create a new model.
- The F-750 can now use the newly created model to non-destructively estimate the parameter of interest.
Calculating Measurements
Unlike traditional spectroscopy which uses the ratio of spectral bands, F-750 measurements are calculated using a PLS based
model built from a training set using user or software selected spectra from 310-1100 nm.
The model building software uses non-linear iterative partial least squares regression (NIPLS) to create coefficients that weight each wavelength based on their relationship to the known values. The F-750 calculates the second derivative spectra for the specimen and applies the training set coefficients to each wavelength to deliver the actual measurement figure.
Quantifying the Accuracy of Measurements
The difference between the specimen spectra and training set spectra along with the ratio of the actual influence vs. the intended weight of each coefficient, are combined to deliver an accurate confidence score with each measurement.
 ()
()